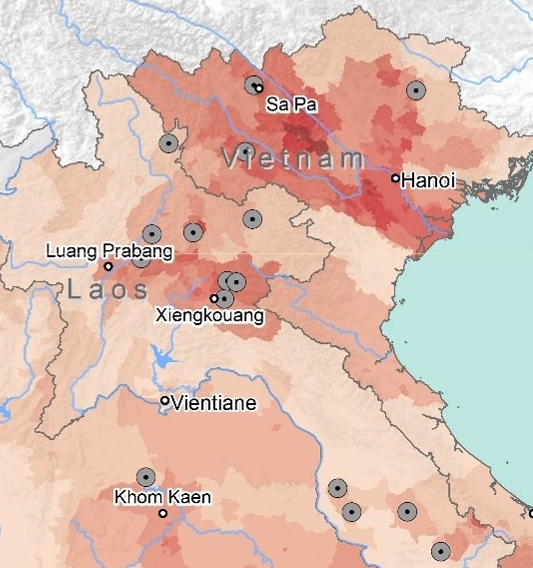
How to use the Datablog? Each tile below contains an interactive graph, figure or map accompanied by a short narrative setting the stage and providing keys for the reading and understanding of the figure. Simply click on the file that interests you to access the story.


